Live View and charts
Follow collection activity, read maps and demographics, and build custom charts.
Updated October 22, 2026. Screenshots use fictional training data. Select an image to enlarge it.
Live View
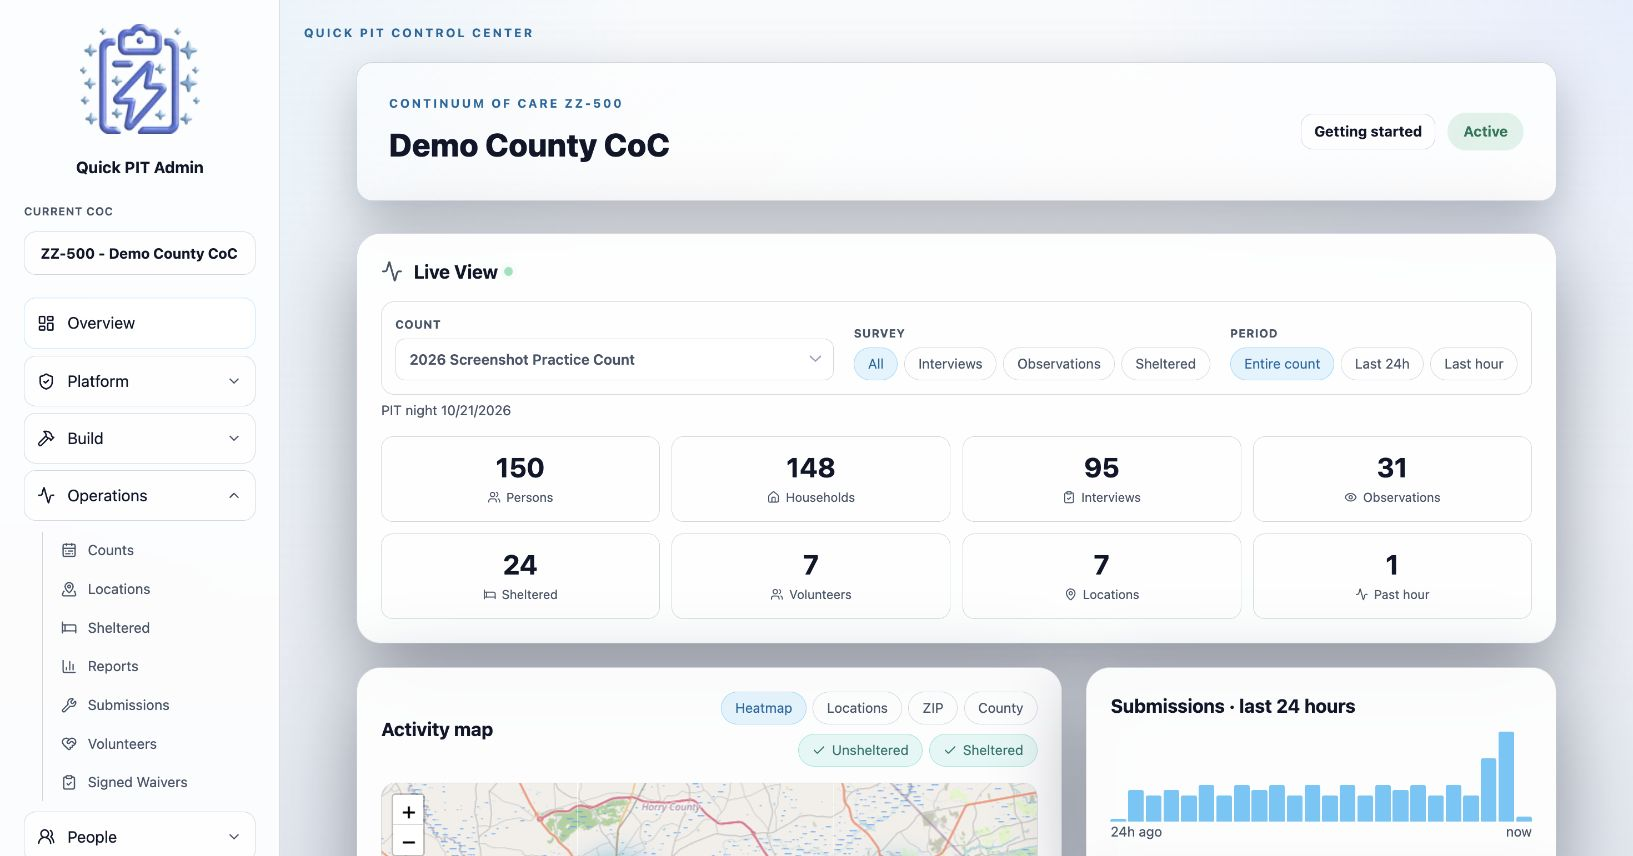
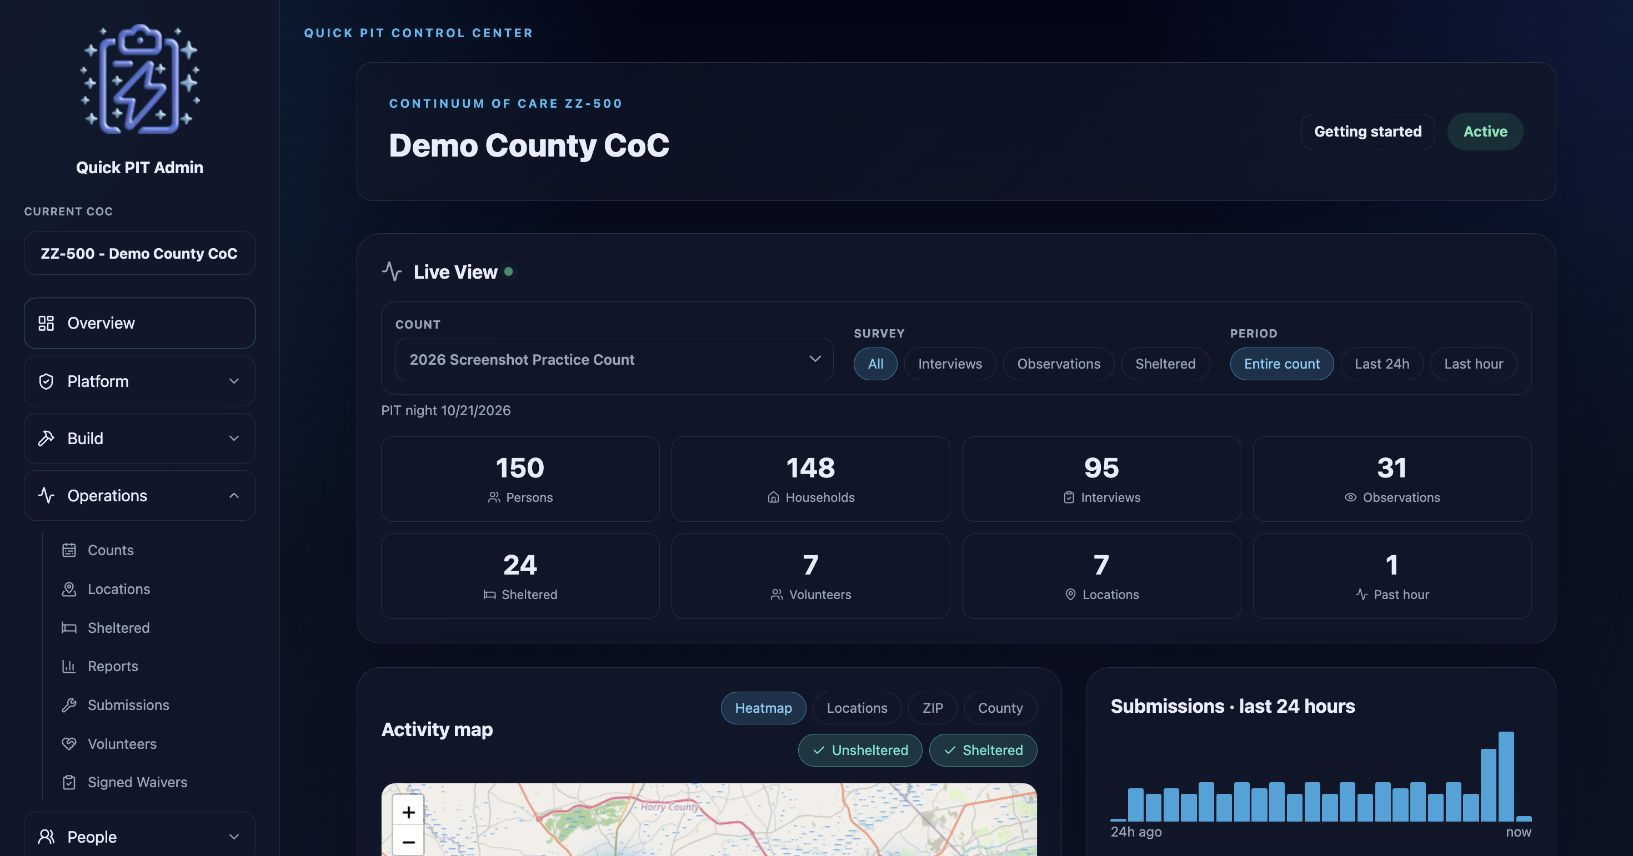
Open Overview to follow collection in Live View. Incoming client responses update its counters, map data, demographics, and recent activity. These are operational views of recorded responses; use Reports for population tables and duplicate review.
Choose the count and narrow the view
- Select the Count you want to monitor.
- Under Survey, choose All, Interviews, Observations, or Sheltered. Custom survey types follow their interview, observation, or sheltered behavior.
- Under Period, choose Entire count, Last 24h, or Last hour.
These filters apply to the live summaries and activity panels. Time-based views use response update times, so editing a response can move it into recent activity. Entire count includes the count’s recorded responses without an additional rolling-time filter.
Read the counters
| Counter | Meaning within the selected view |
|---|---|
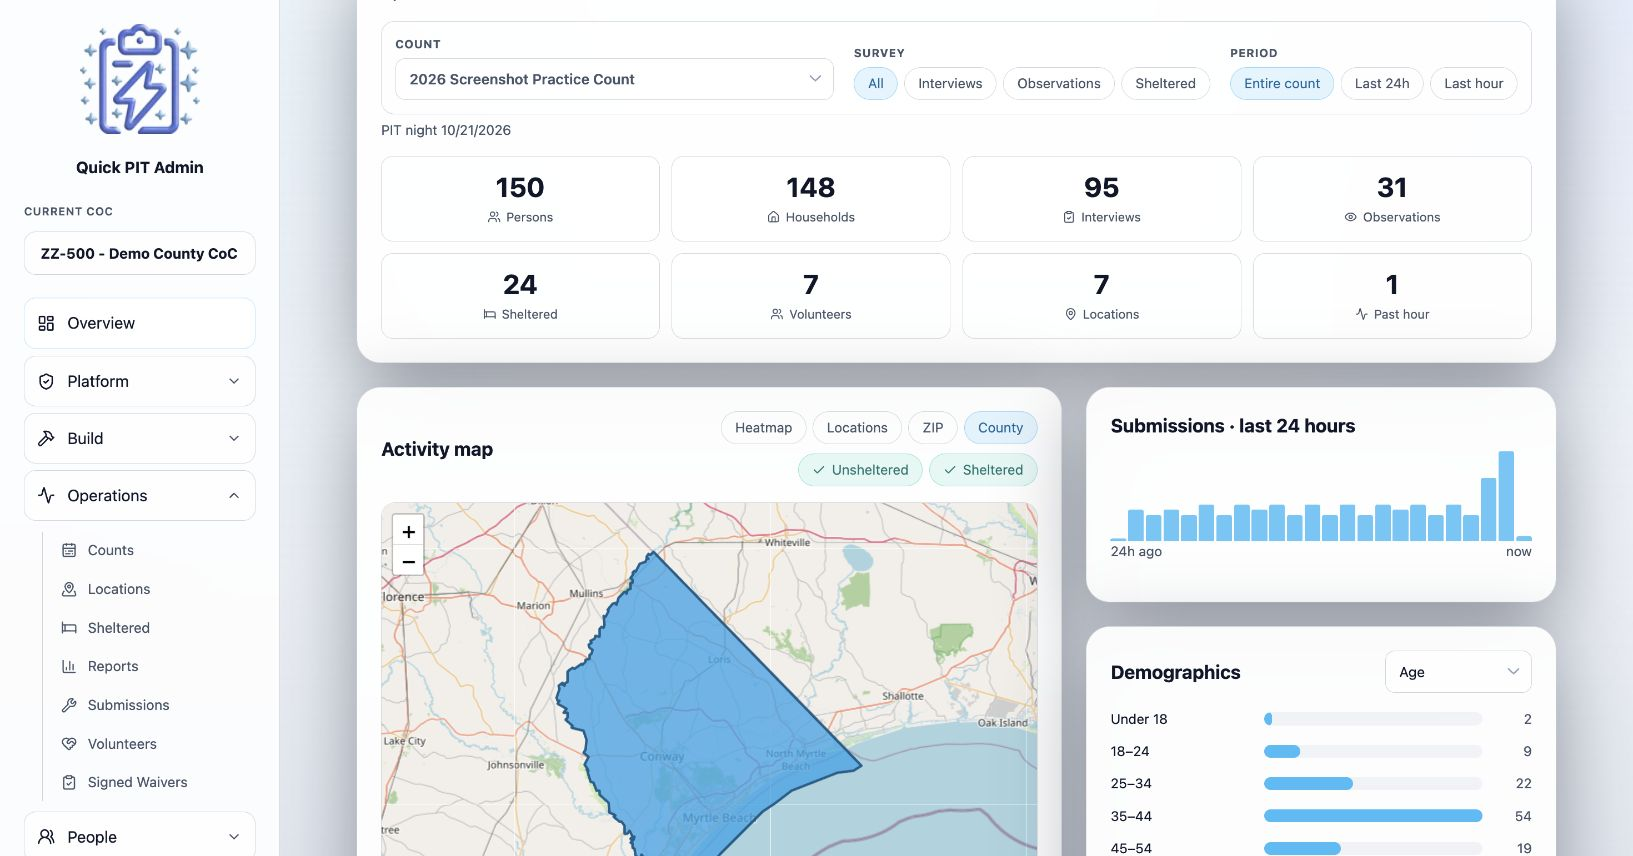
| Persons | Recorded client responses, including interview, observation, and sheltered records |
| Households | Recorded household heads, plus one household for each observation response |
| Interviews | Interview-style responses |
| Observations | Observation-style responses |
| Sheltered | Sheltered-style responses |
| Volunteers | Different user accounts that recorded client responses, not everyone on the roster or everyone who answered a Volunteer Survey |
| Locations | Different field locations represented in responses; sheltered programs are listed separately |
| Past hour | Responses in the selected view updated within the last hour |
Explore the activity map
Choose a map mode:
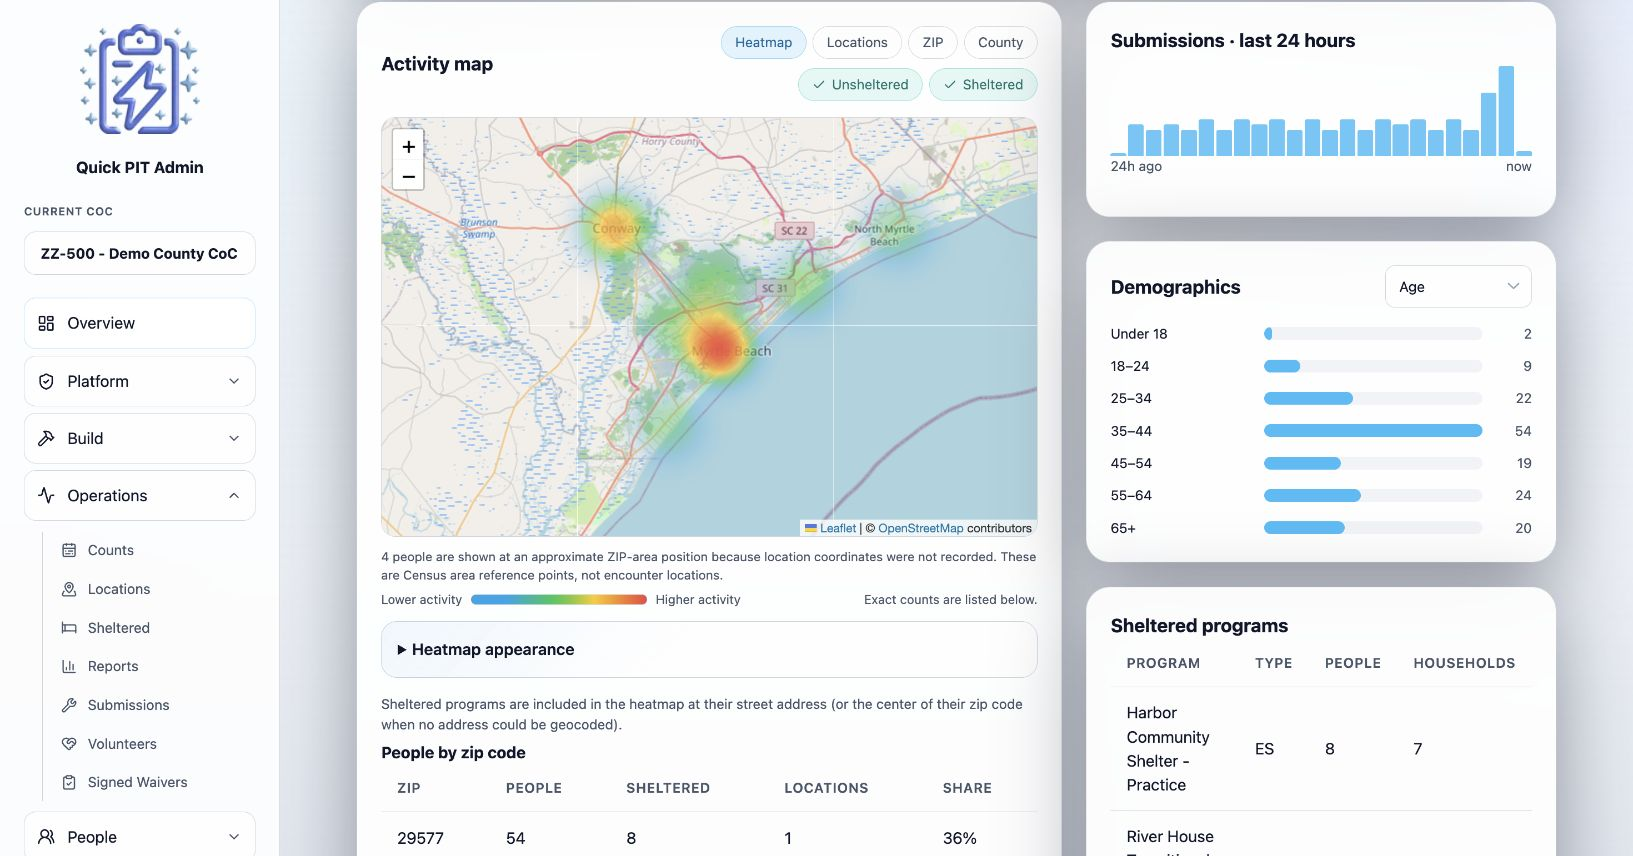
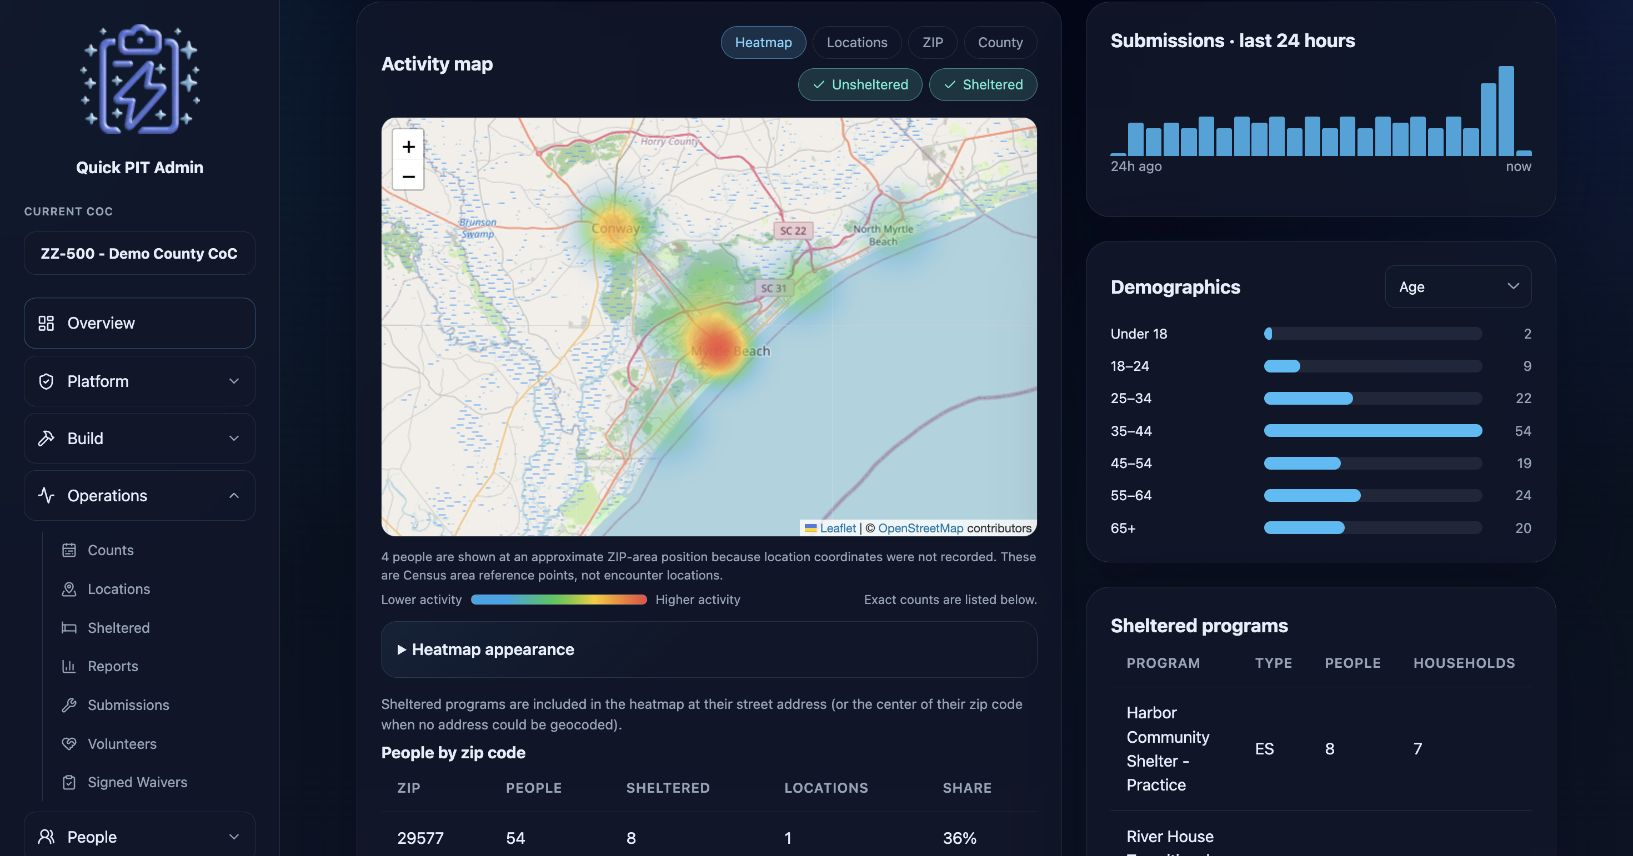
- Heatmap shows concentrations of activity. Expand Heatmap appearance below the map to adjust its display. Opacity changes color strength. A lower Level makes busy areas reach red sooner. Reset restores the default appearance. These controls change your view, not the records or totals.
- Locations shows count-sized markers for field locations and teal markers for included sheltered programs.
- ZIP groups activity by ZIP and shades available Census ZIP areas.
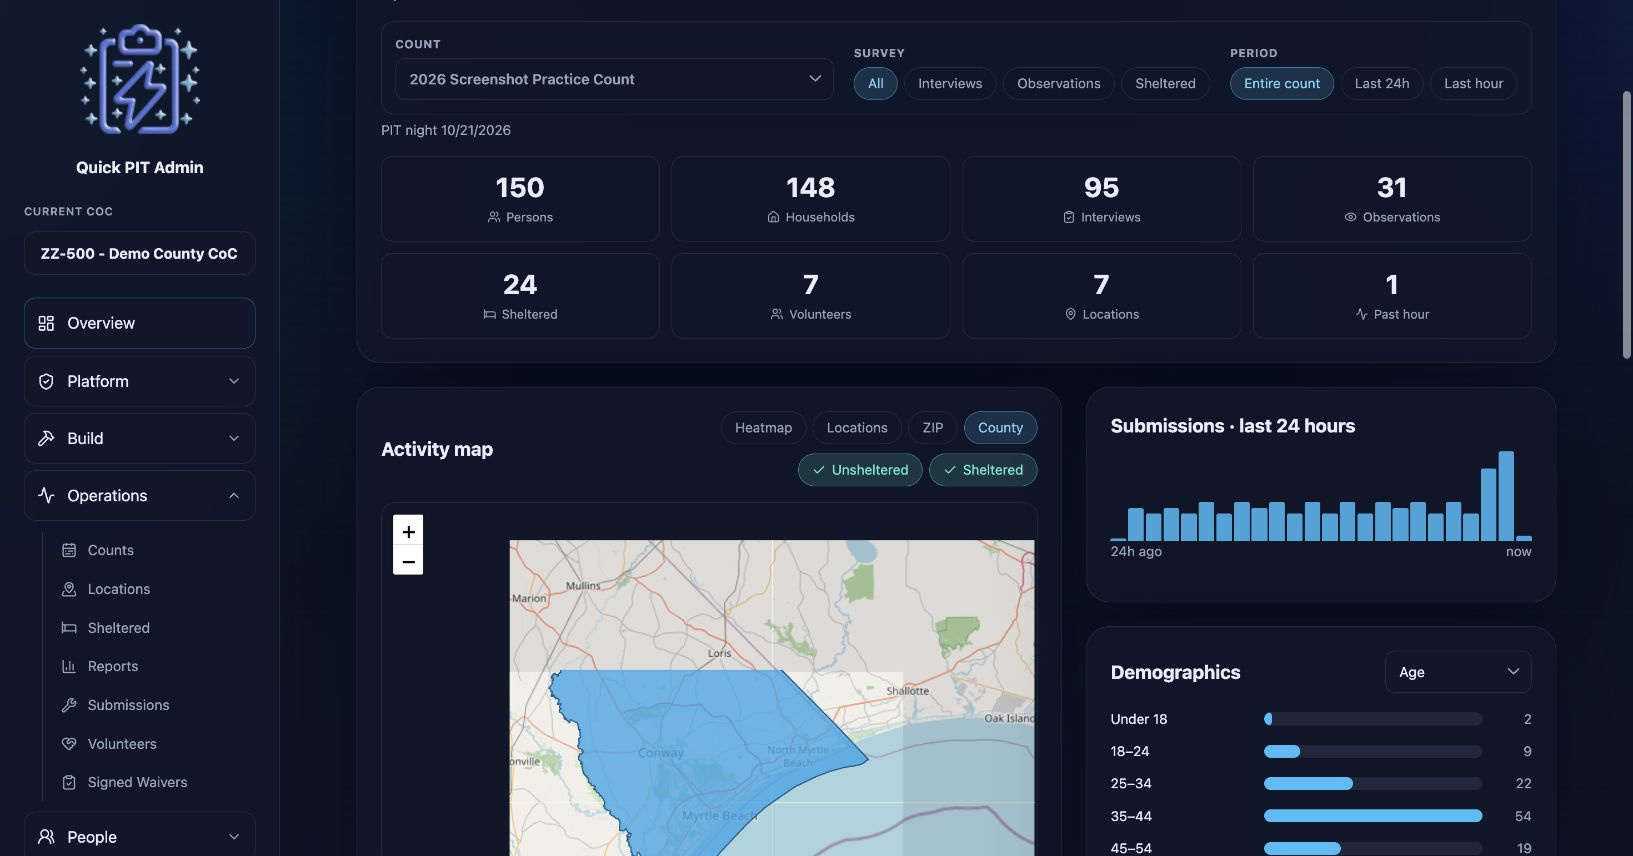
- County groups activity within available county boundaries and shows People by county, including Approx. from ZIP, sheltered totals, sites, and share.
Use the Unsheltered and Sheltered buttons to include either or both populations on the map and its geographic table. These buttons do not change the top counters, demographics, recent activity, or saved custom charts. Hover over markers or shaded areas for details.
Recorded coordinates give a more specific position. Without them, the map may use an approximate ZIP reference point. A ZIP can cross county lines, so county assignment from that point is approximate too. Census ZIP areas approximate postal delivery areas. Read the map’s notices when boundaries are unavailable or records cannot be placed.
The table below the map provides exact totals for the included records. It shows People by zip code except in County mode. Records without a usable position can remain in tables even when no marker appears; map color is not a substitute for those totals.
Geography is shared within your CoC and reused: successful lookups are saved for 90 days, and confirmed no-matches for 7 days. After service failures, new lookups pause for 1 minute, then 5 minutes, 15 minutes, and up to 1 hour after repeated failures. A successful lookup resets that sequence. Reloading does not necessarily trigger a fresh lookup during these periods.
Check activity and demographics
Submissions · last 24 hours shows hourly activity within your chosen filters. Demographics lets you switch among Age, Gender, Race, and Veteran status. Multiple-choice answers can contribute to more than one category.
The Sheltered programs table shows recorded people and households by program. Recent activity shows the latest eight matching records with survey type, place, and relative time, without client names.
Custom charts
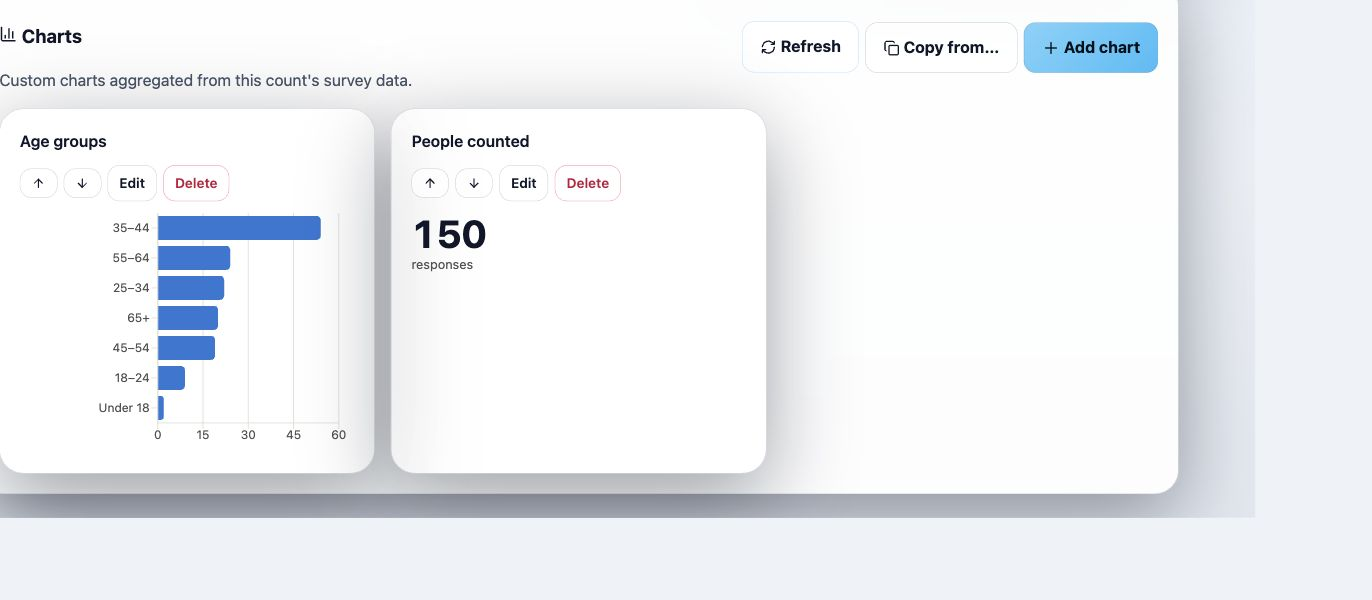
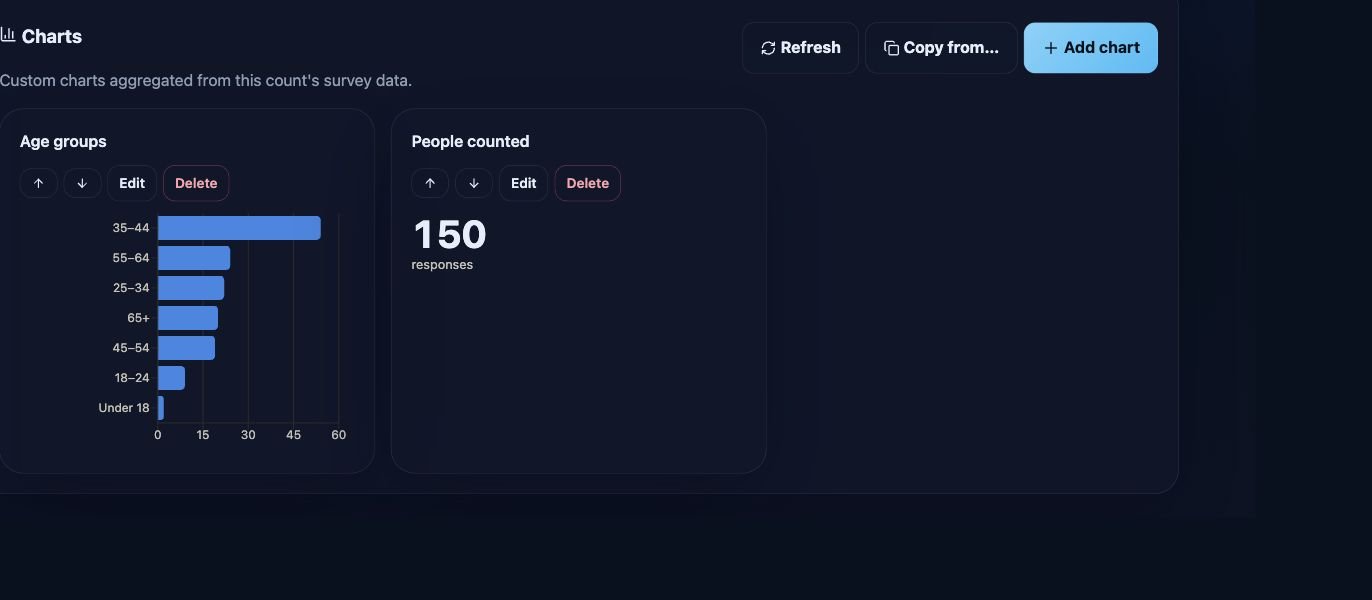
The Charts section appears on Overview, Reports, and Volunteers. Each page keeps a separate chart set for each count. Overview and Reports use client responses; Volunteers uses volunteer responses.
Saved charts use the selected count and their own settings. They do not inherit Live View’s Survey, Period, or map inclusion controls, or Reports’ Raw/Extrapolated selection.
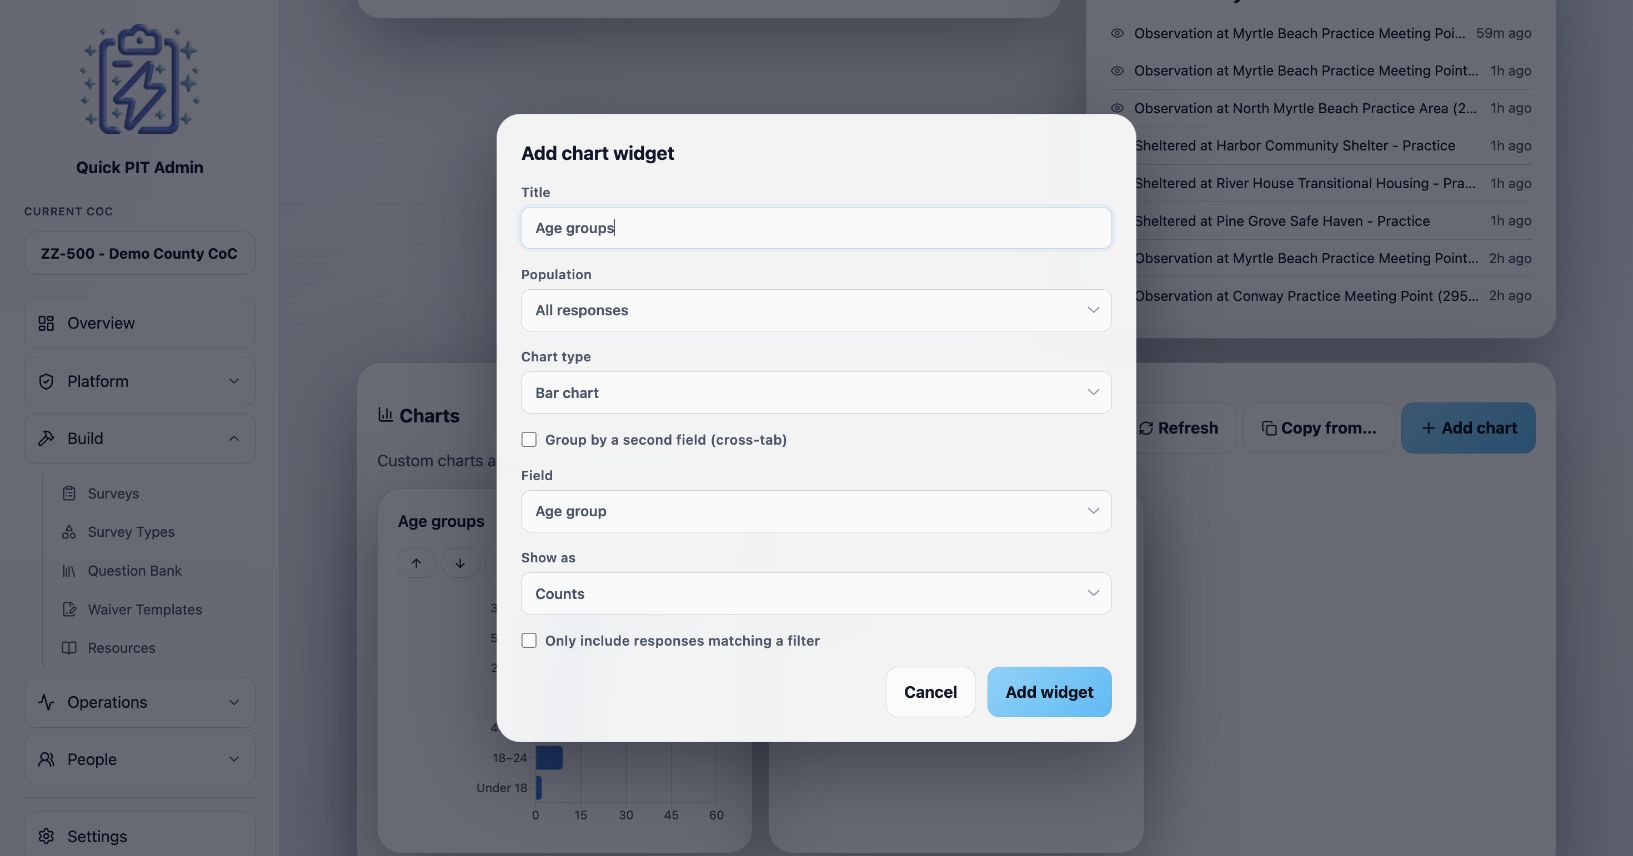
Add a chart
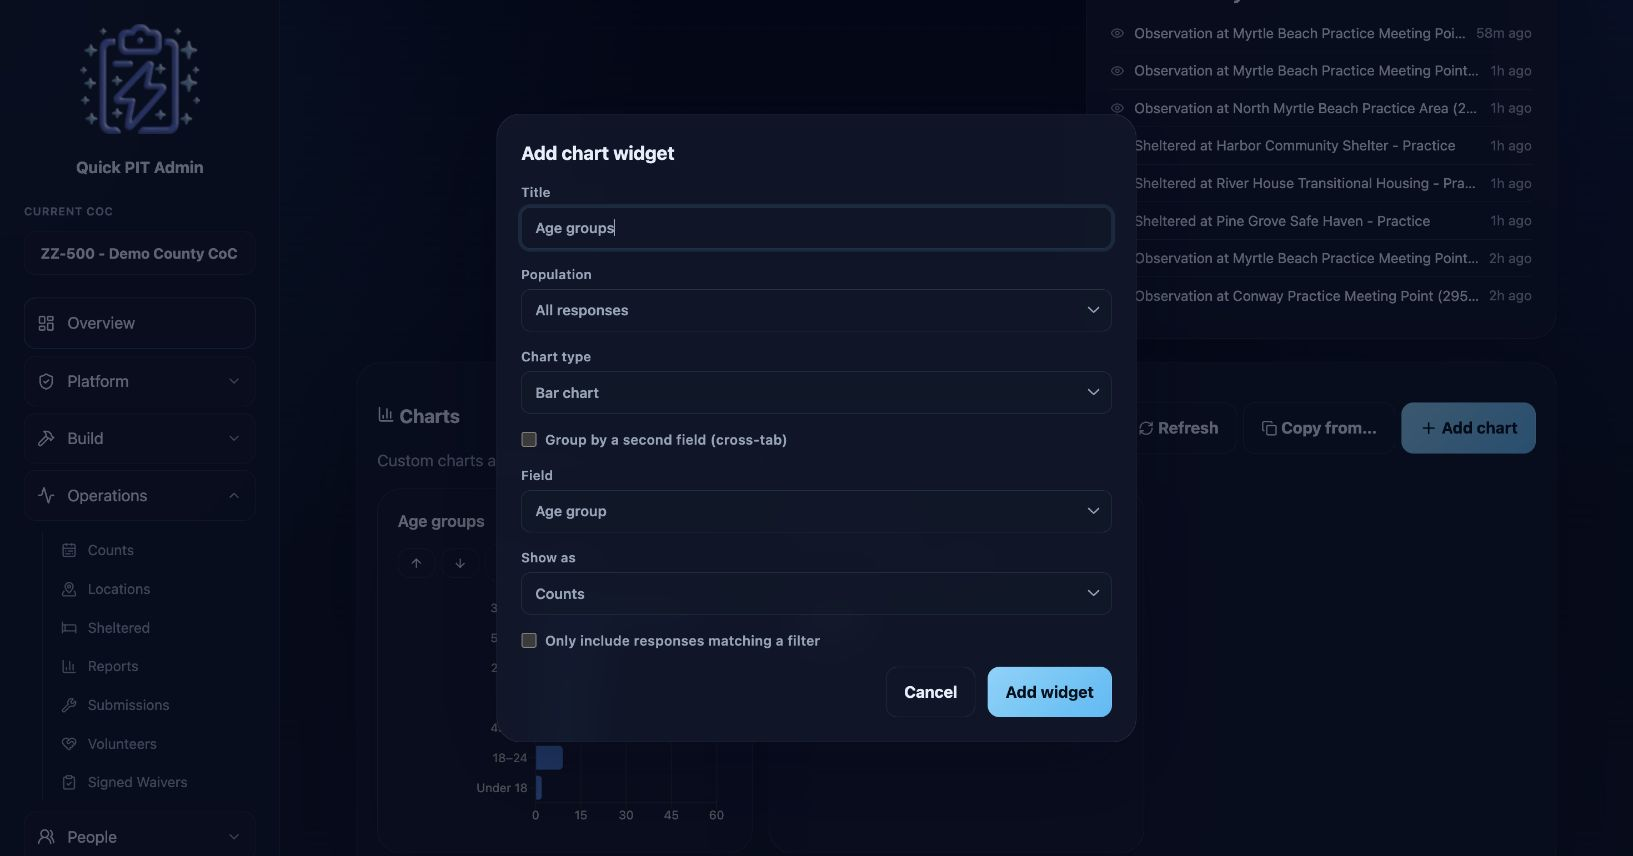
- Select Add chart and enter a descriptive Title.
- For client charts, choose Population: All responses, Unsheltered (interview + observation), or Sheltered programs.
- Choose Chart type and configure it:
| Chart type | Use and controls |
|---|---|
| Bar chart | Compare categories from a selected Field |
| Pie / donut | Show a field’s category distribution as a donut |
| Line (over time) | Show response counts By day or By hour, using response update times and the CoC timezone |
| Stat tile (single number) | Show the number of matching response records |
| Table | Read category counts or percentages, or compare two fields |
- Choose a Field when offered. Client fields include Merged concepts, such as Age group and Gender, which combine equivalent answers across survey types, and Specific questions from the count’s attached client surveys. Volunteer fields come from the attached Volunteer Survey.
- For a bar chart or table, optionally enable Group by a second field (cross-tab). Choose Group by (rows) and Then by (columns). For example, compare Age group by Gender.
- Optionally enable Only include responses matching a filter, then choose its Field, Condition (is, is not, or contains), and Value.
- Select Add widget to save.
Use Table with Show as → Percentages when you need displayed percentages. Multi-select breakdowns count answer selections, so their totals and percentages need not describe unique people. Blank answers appear as (No answer); charts with many categories may group smaller categories as Other.
Maintain and refresh charts
Use Edit and Save changes to adjust a chart. The up/down arrows change its order. Delete removes the chart after confirmation, without deleting its underlying responses.
Copy from… copies this page’s chart set from another count in the same CoC. Choose Source count, then Copy charts. Existing charts remain. Review copied fields and filters against the new count’s surveys.
Live View counters stream updates, while its custom charts check approximately every 30 seconds when the browser tab is visible. Chart results can be cached. Use the Charts section’s Refresh after correcting answers or whenever you need current chart results; Reports’ Recompute is a separate action. Reports and Volunteers charts do not continuously poll.
Volunteer chart totals currently include all volunteer response records associated with the count, including declines and older survey versions. The volunteer list only shows the currently attached survey, so its row count may differ from a chart total.